GraphStream Demos
Demonstrations of Sample Code Projects
Politechnika Poznańska – April 24th 2018
Outline
- General Presentation of GraphStream
- Demonstrations and Examples
Installation of GraphStream
- Get GraphStream’s jar files from GitHub’s release page : https://github.com/graphstream/gs-core/releases
- Use Maven (or gradle etc.) and configure GraphStream as a dependency
Get the tutorial workspace
- Go to the tutorial page at github: github.com/graphstream/gs-talk
- Get the code:
- with the “Download Zip” button on github (will download an archive)
- or through git:
In that project, we want the Demos/ folder.
Demo 1 – A simple static graph
Basic tasks with GraphStream
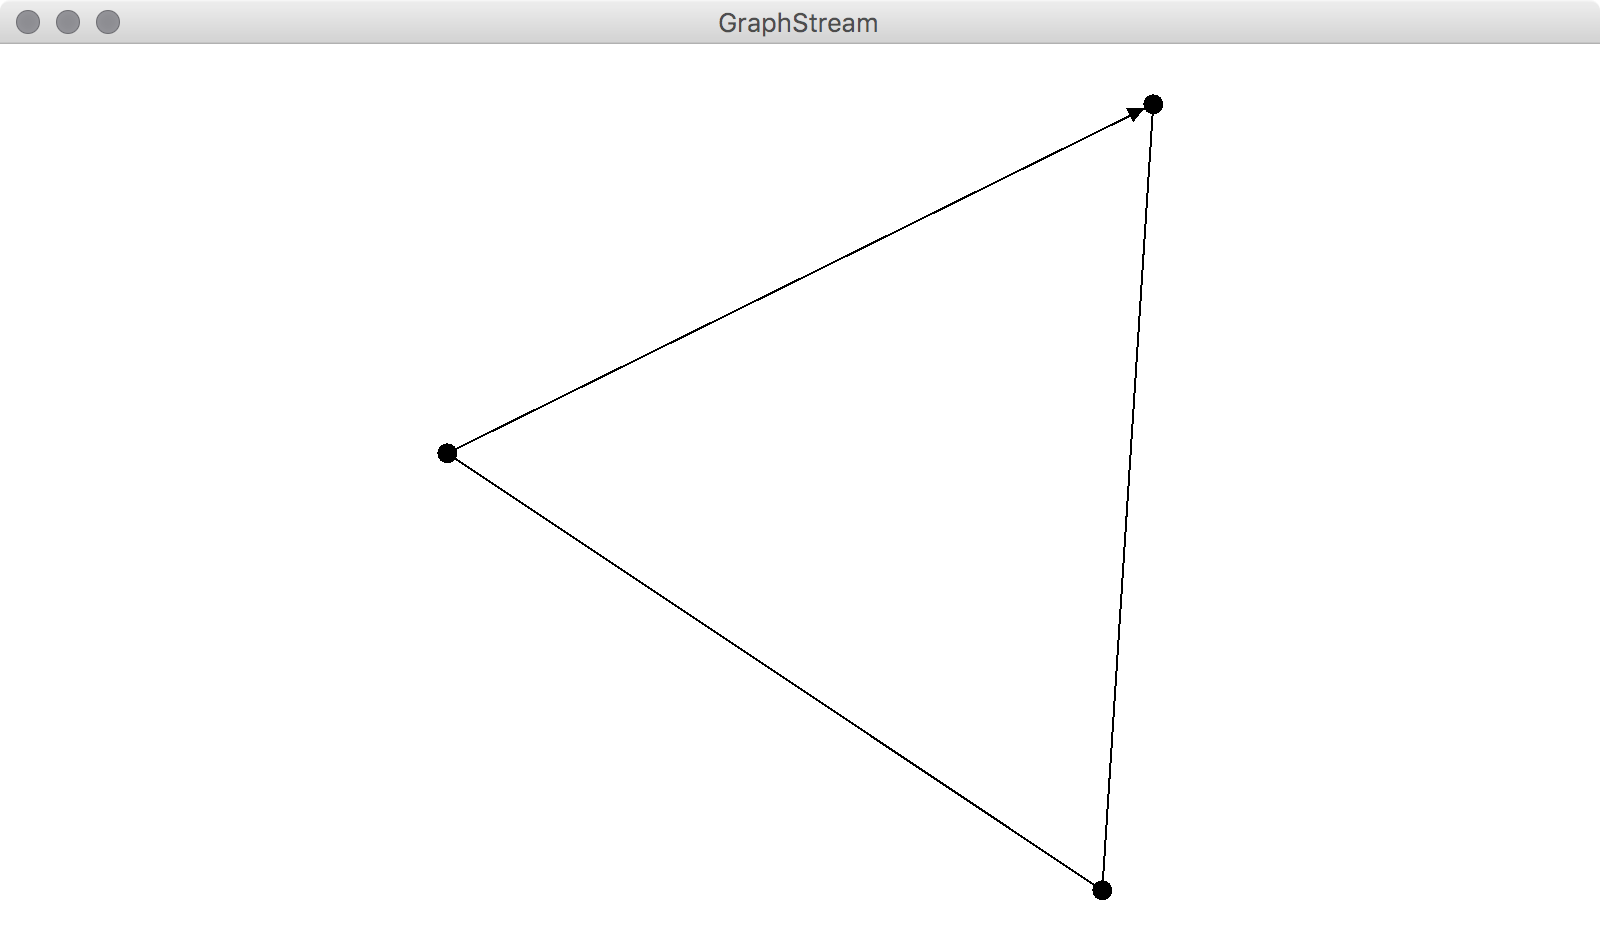
Create and display
public class Demo1 {
    public static void main(String args[]) {
        System.setProperty("org.graphstream.ui", "swing");
        Graph graph = new SingleGraph("Demo 1");
        graph.display();
        graph.addNode("A");
        graph.addNode("B");
        graph.addEdge("AB", "A", "B");
        graph.addNode("C");
        graph.addEdge("BC", "B", "C", true); // Directed edge.
        graph.addEdge("CA", "C", "A");
    }
}
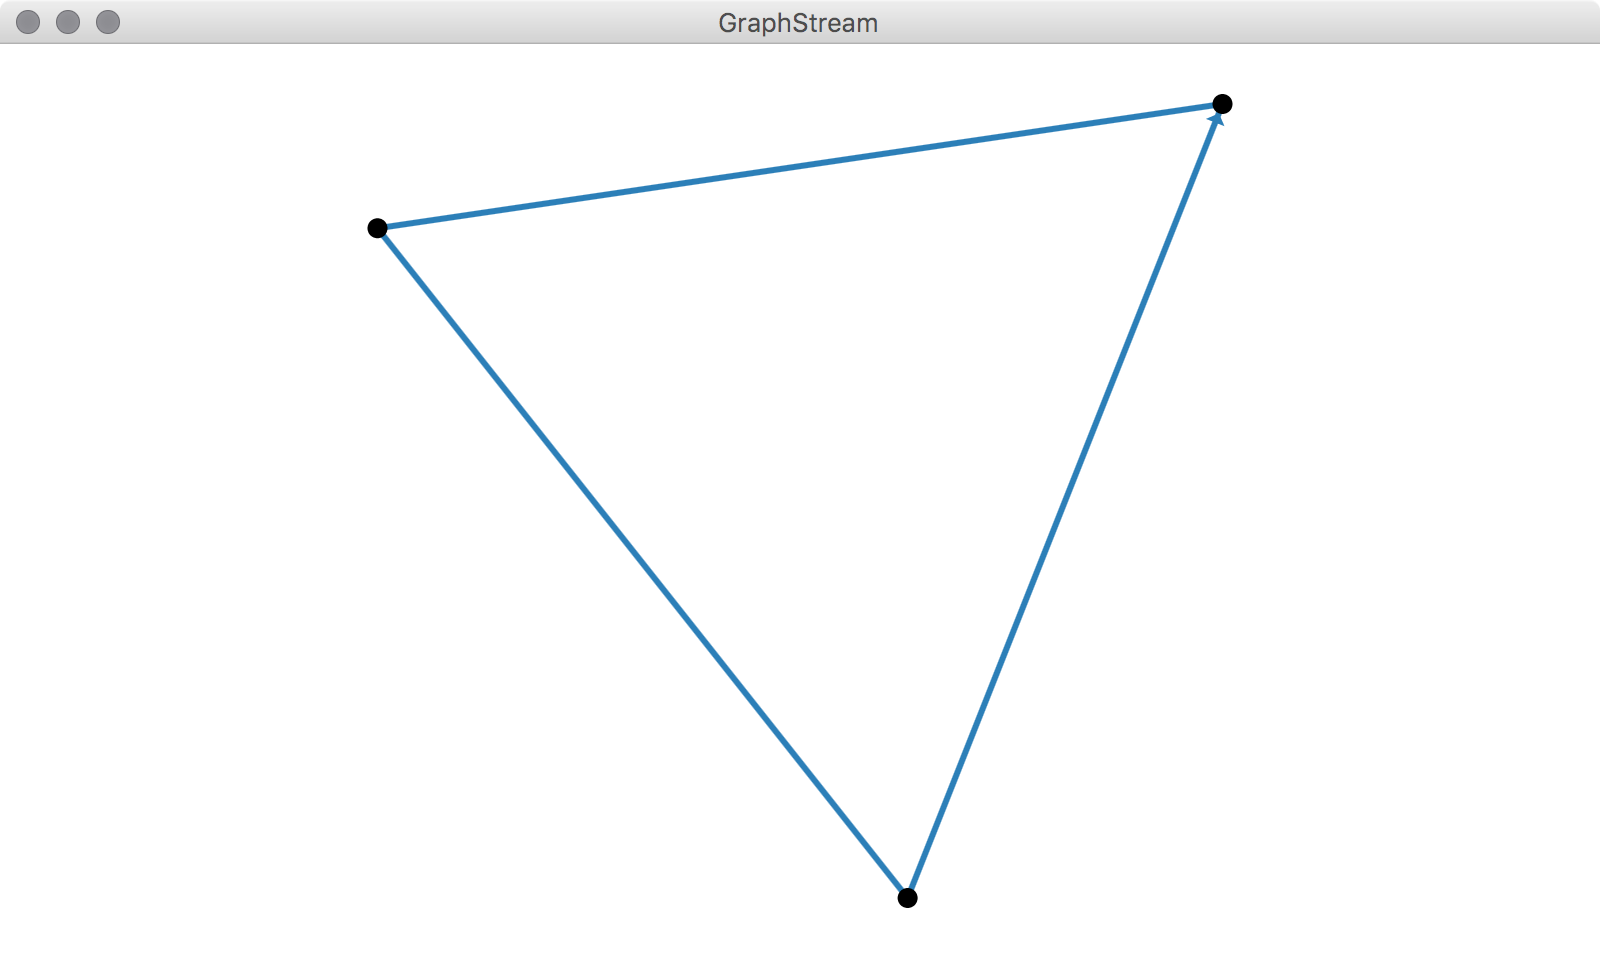
Change the Display with CSS
We can improve the display with some CSS:
Access Elements
- Nodes and edges are identified by an unique string.
They are accessible at creation time:
Or after creation:
Constructive API vs. Events
Nodes and edges are removed the same way:
- Each change, at anytime, is considered as an “event”.
- The sequence of changes is seen as the dynamics of the graph.
There are many other ways to modify the graph.
Attributes
Data stored in the graph, on nodes and edges, are called “attributes”. An attribute is a pair (name,value).
Edge ab = graph.getEdge("AB");
Edge bc = graph.getEdge("BC");
Edge ca = graph.getEdge("CA");

ab.setAttribute("ui.label", "AB");
bc.setAttribute("ui.label", "BC");
ca.setAttribute("ui.label", "CA");

for(String id : new String[]{"A", "B", "C"}){
    graph.getNode(id).setAttribute("ui.label", id);
}
graph.setAttribute("ui.stylesheet", "url(data/style.css);");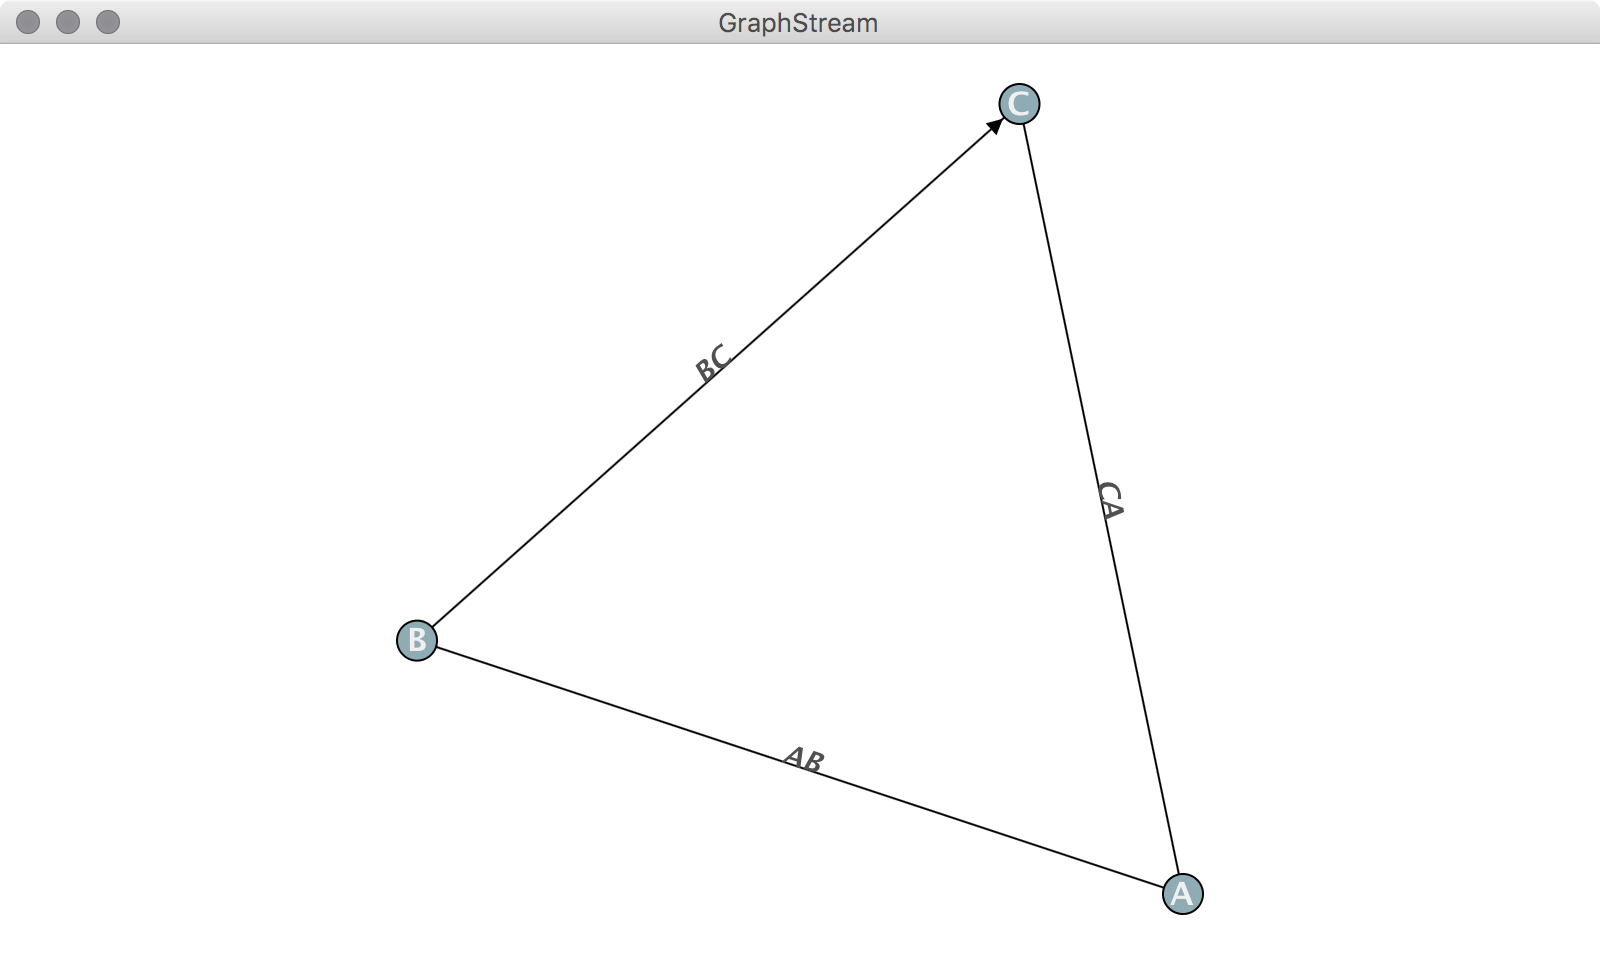
Define Attributes
- Not all attributes appear in the viewer.
- Notice the way you can add arrays with
setAttribute()and a variable number of arguments:
Retrieve Attributes
Several ways to retrieve attributes:
int value1 = ((Number) ab.getAttribute("aNumber")).intValue();
double value2 = (double) bc.getAttribute("anObject");
Object[] value3 = (Object[]) ca.getAttribute("anArrayOfThings");
Special methods are here to simplify access:
Traversing the graph
GraphStream 2.0 uses Java 8 streams.
Access all nodes:
Equally for edges:
Index-based access
Indices for nodes:
int n = graph.getNodeCount();
for(int i=0; i<n; i++) {
    System.out.println(graph.getNode(i).getId());
}
Indices for edges:
int n = graph.getEdgeCount();
for(int i=0; i<n; i++) {
    System.out.println(graph.getEdge(i).getId());
}
⚠ indices remain the same as long as the graph is unchanged. ⚠
Travers from nodes and edges
You can also travel the graph using nodes:
import static org.graphstream.algorithm.Toolkit.*;
//...
Node node = randomNode(graph);

node.edges().forEach(e -> {
    System.out.printf("neighbor %s via %s%n",
        e.getOpposite(node).getId(),
        e.getId() );
})- Each node and edge allow to iterate on their neighborhood.
Toolkitis set of often used functions and small algorithms (see the API).
Orientation-based interaction
Directed edges stream from a given node:
Get a node’s degree, entering degree or leaving degree:
Demo 2
Dynamic Graphs
Sinks
- A graph can receive events. It is a sink.
- A sink is connected to a source using the
Source.addSink(Sink)method. - Events are filtered by type (Elements Events and Attributes Events) :
addElementSink(ElementSink). Nodes and edges are Elements.addAttributeSink(AttributeSink). Data attributes are stored on every element.
- A
Sinkis both anElementSinkandAttributeSink.
ElementSink
ElementSink is an interface
AttributeSink
An attribute sink must follow the interface:
public interface AttributeSink {
    void graphAttributeAdded( ... );
    void graphAttributeChanged( ... );
    void graphAttributeRemoved( ... );

    void nodeAttributeAdded( ... );
    void nodeAttributeChanged( ... );
    void nodeAttributeRemoved( ... );

    void edgeAttributeAdded( ... );
    void edgeAttributeChanged( ... );
    void edgeAttributeRemoved( ... );
}
Source
A source is an interface that only defines methods to handle a set of sinks.
public interface Source {
    void addSink(Sink sink);
    void removeSink(Sink sink);
    void addAttributeSink(AttributeSink sink);
    void removeAttributeSink(AttributeSink sink);
    void addElementSink(ElementSink sink);
    void removeElementSink(ElementSink sink);
    void clearElementSinks();
    void clearAttributeSinks();
    void clearSinks();
}
A first dynamic graph
Since Graph is a sink let’s create a graph from a set of events generated by a source.
- A file with information about graphs (in a proper file format) can be a source of events.
- A few graph file formats can handle dynamic.
- GraphStream provides a file format (DGS) that allows to store and load dynamic graphs.

The GDS File Format
anfor “add node”.aefor “add edge”.ae "AB" "A" > "B"adds a directed edge between nodesAandB.cn,ceandcgchange or add one or more attributes on a node, an edge or the graph.dnanddeallow to remove nodes, edges.
How to handle dynamics
- Storing temporal information is tricky.
- Timestamps on events is a good way to encode time
- But some events occur at the same time.
- Let’s define time steps within events
st <number>
Steps in DGS
The ability to remove nodes and edges makes the format support dynamic.
Read the whole file
The file can be read entirely :
- However this will send all events as fast as possible.
- We have no control over the speed at which events occur.
Read the file event by event
We can read the DGS file event by event using an input source:
Graph graph = new SingleGraph("Demo2");
graph.display();
FileSource source = new FileSourceDGS();
source.addSink( graph );
source.begin("data/demo2.dgs");
while( source.nextEvents() );
source.end();Read the file step by step
- The
nextEvents()method reads the file event by event (line by line in the file) - The
nextStep()methods reads events up to the nextstcommand (all the lines between twostlines)
Graph Layout
- By default spacial positions of nodes on the display are automatically computed.
- However one may want to position nodes by ourself.
- One can do this using the
xandyattributes:
Then one have to tell the viewer not to compute nodes positions:
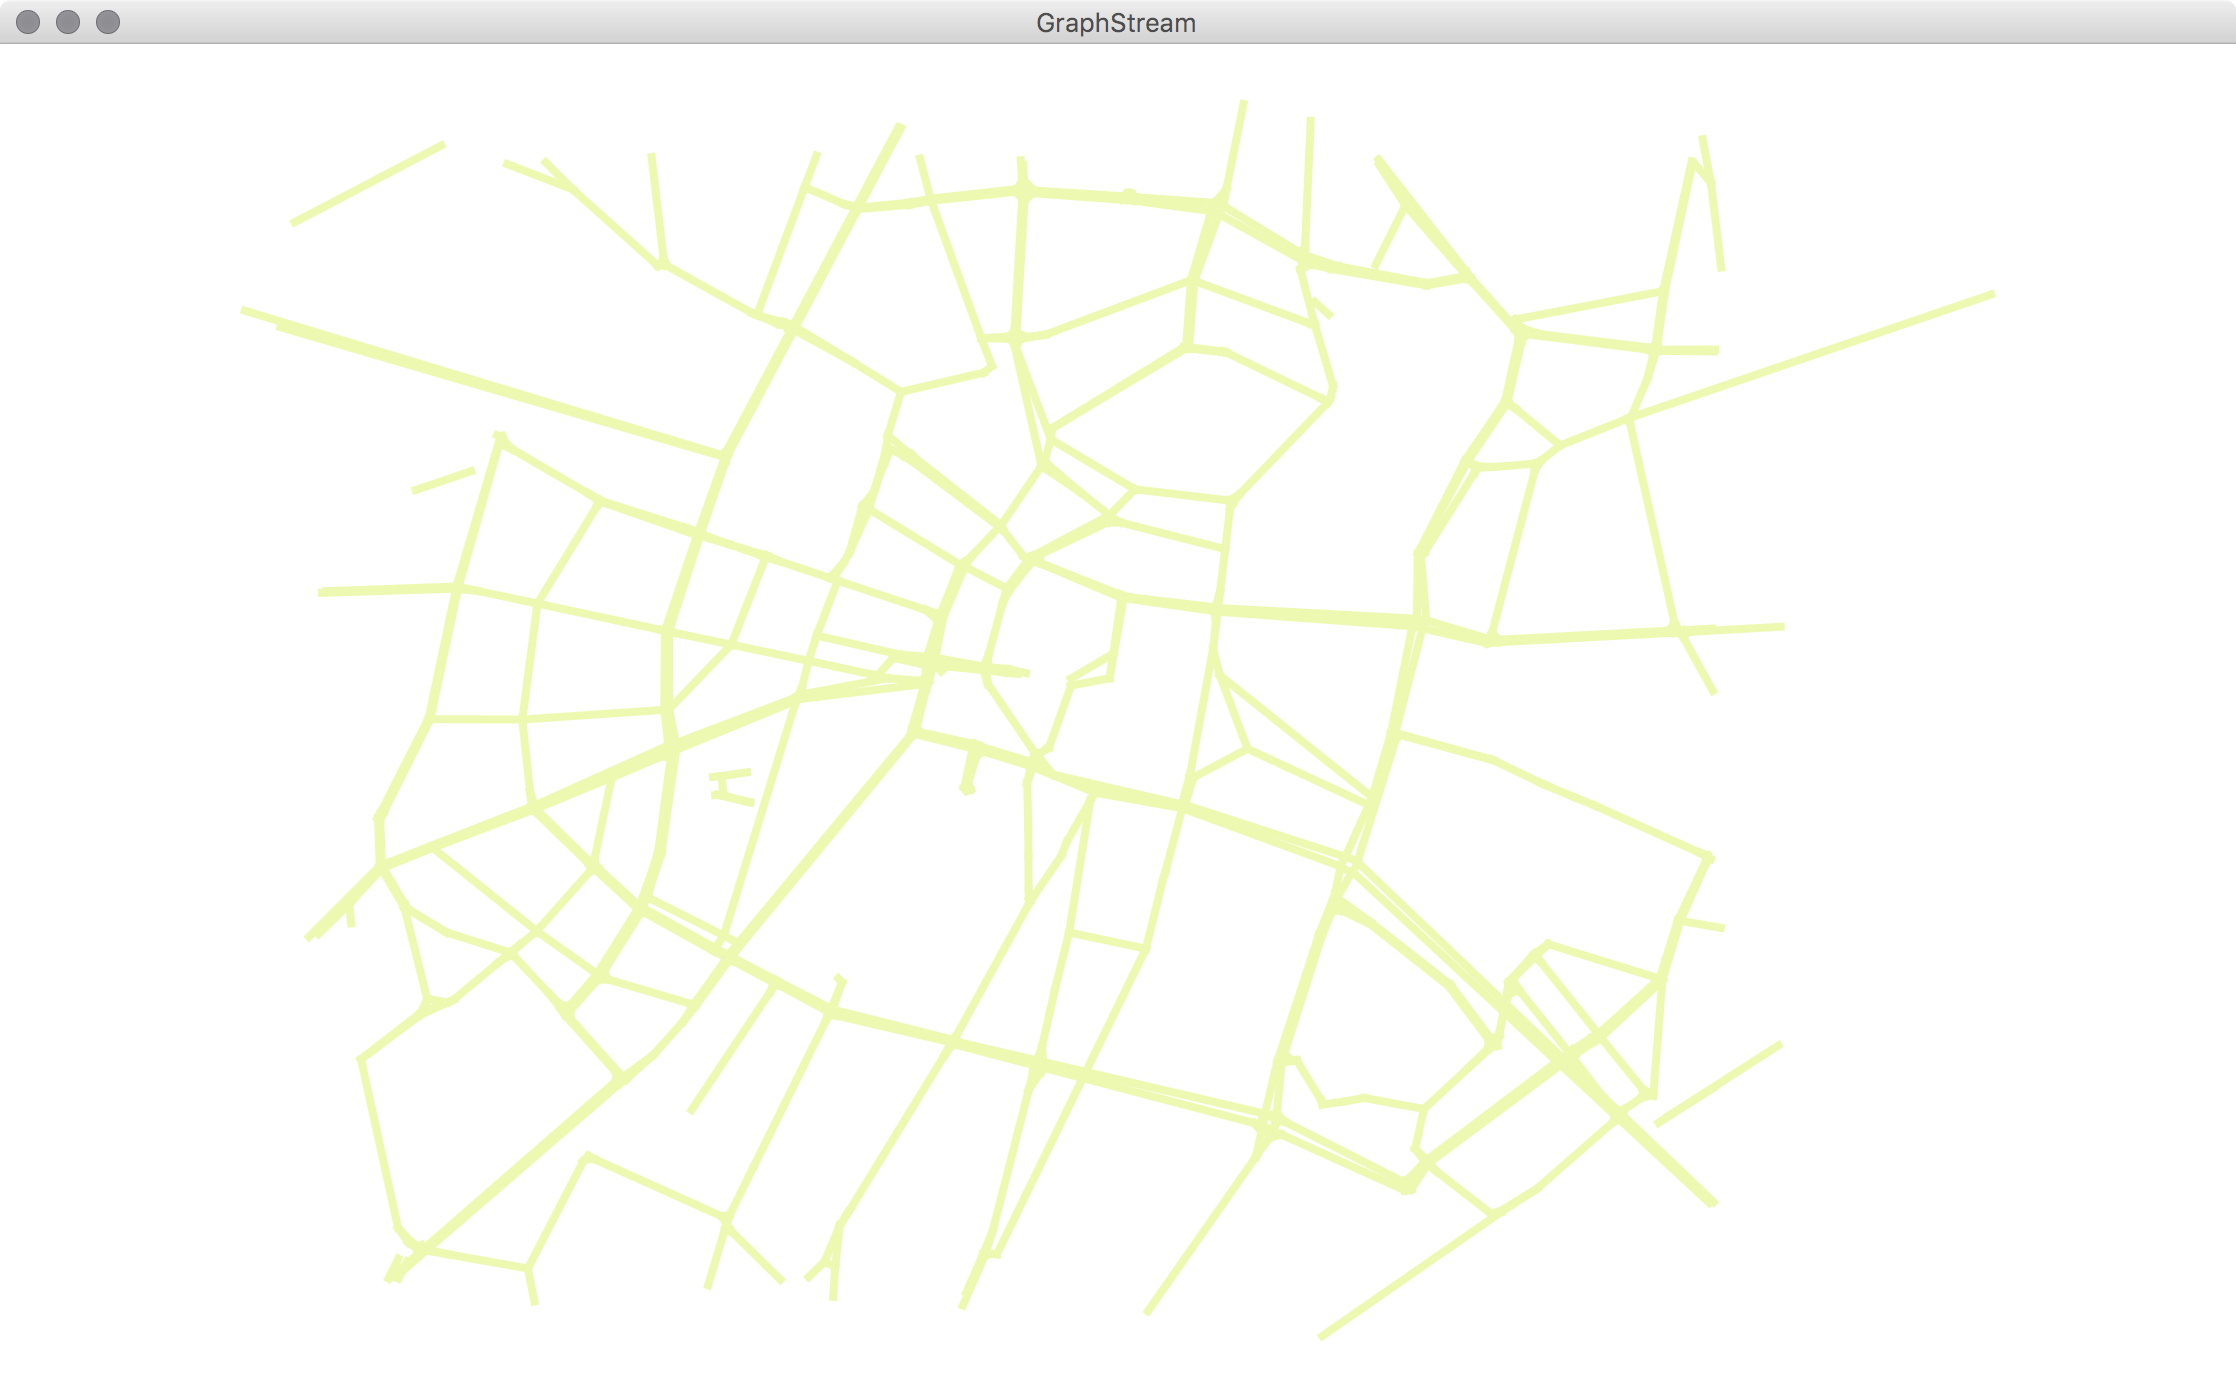
Demo 3
Geographic Graphs
Working with geographic data
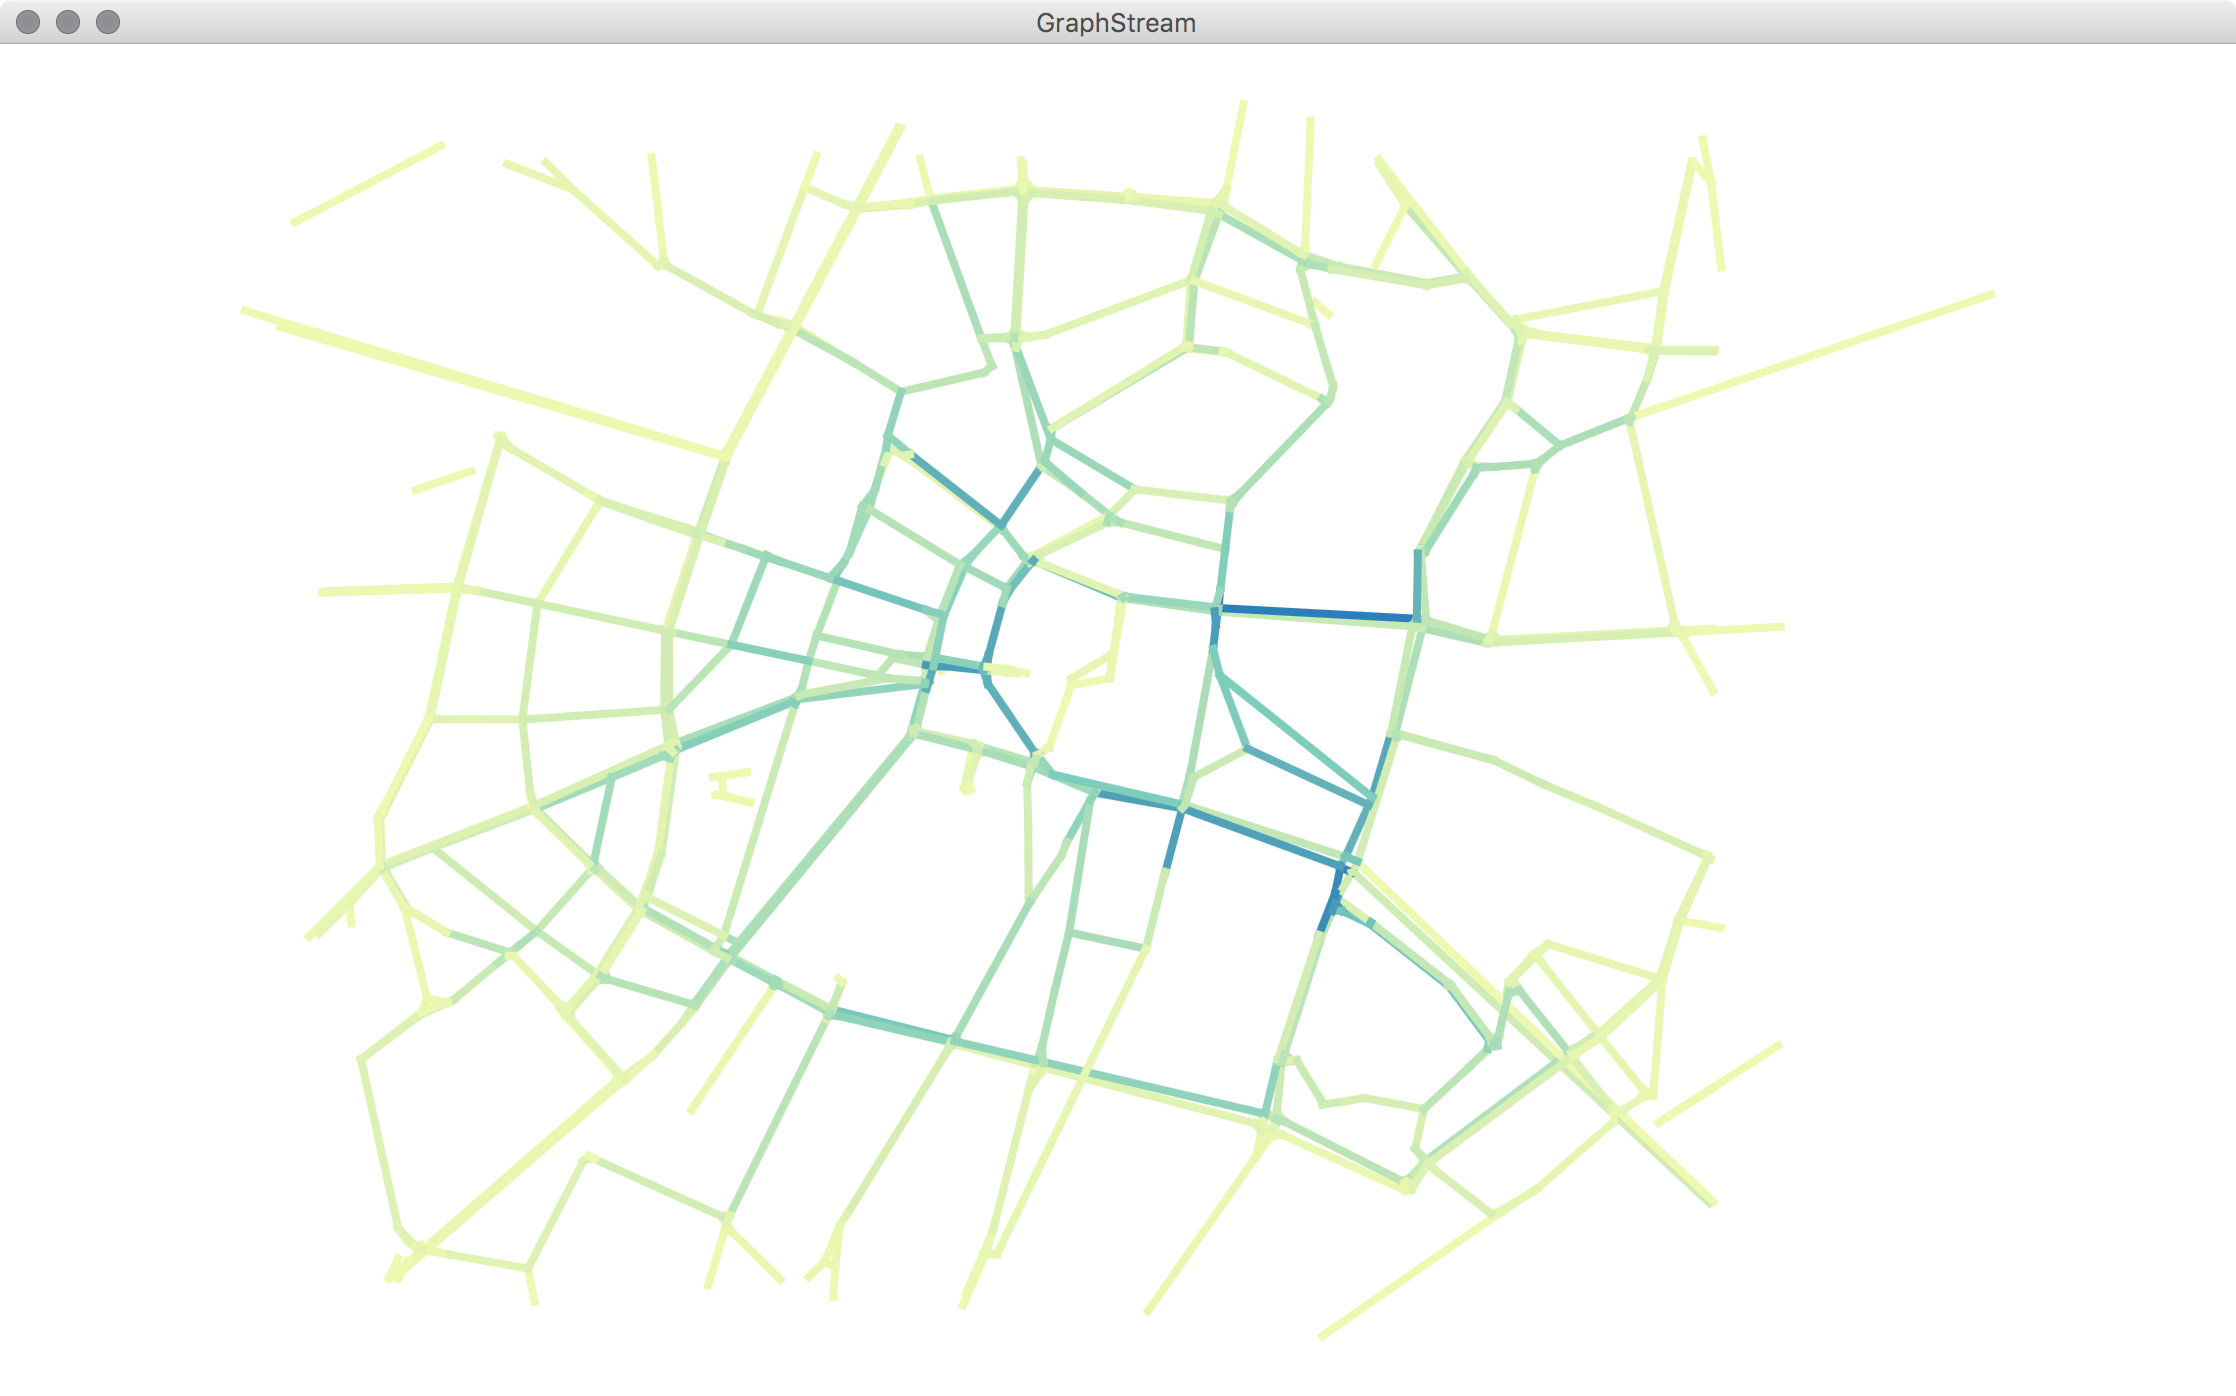
The gs-geography project brings the opportunity to read geographical data file format and produce graphs.
For instance, one can read an OpenStreetMap map to produce a graph of the road network, where nodes would be intersections and edges would be roads.
Graph Algorithms for geographic data