GraphStream Tutorials
Politechnika Poznańska – April 24th 2018
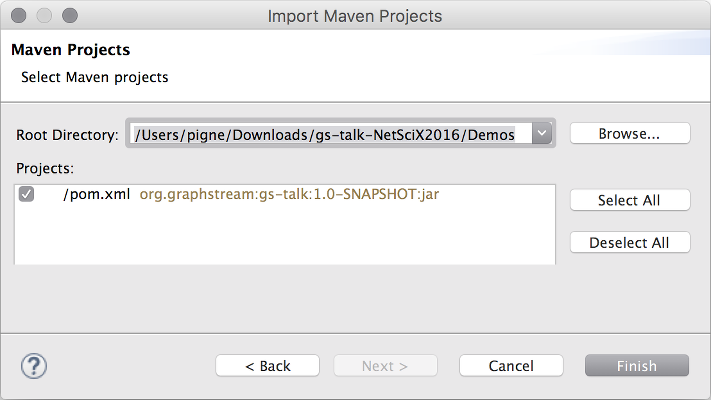
Import the project
- When asked about a workspace, indicate a new workspace or any existing one.
- Go to menu
File > Import > Maven > Existing Maven Projects. Browse to the project (Demos/folder), Eclipse should recognize the project.
Orientation-based interaction
You can iterate on directed edges:
Or:
And get the node degree, entering or leaving:
System.out.println(“Node degree %d (entering %d, leaving %d)%n”,
    node.getDegree(),
    node.getInDegree(),
    node.getOutDegree());
#Tutorial 2
###A first dynamic graph
#Sinks - A graph can receive events. It is a sink. - A sink is connected to a source using the Source.addSink(Sink) method. - Events are filtered by type (Elements Events and Attributes Events) : - addElementSink(ElementSink). Nodes and edges are Elements. - addAttributeSink(AttributeSink). Data attributes are stored on every element. - A Sink is both an ElementSink and AttributeSink.
#ElementSink ElementSink is an interface
public interface ElementSink {
    void nodeAdded( ... );
    void nodeRemoved( ... );
    void edgeAdded( ... );
    void edgeRemoved( ... );
    void graphCleared( ... );
    void stepBegins( ... );
}
#AttributeSink An attribute sink must follow the interface:
public interface AttributeSink {
    void graphAttributeAdded( ... );
    void graphAttributeChanged( ... );
    void graphAttributeRemoved( ... );

    void nodeAttributeAdded( ... );
    void nodeAttributeChanged( ... );
    void nodeAttributeRemoved( ... );

    void edgeAttributeAdded( ... );
    void edgeAttributeChanged( ... );
    void edgeAttributeRemoved( ... );
}
#Source A source is an interface that only defines methods to handle a set of sinks.
public interface Source {
    void addSink(Sink sink);
    void removeSink(Sink sink);
    void addAttributeSink(AttributeSink sink);
    void removeAttributeSink(AttributeSink sink);
    void addElementSink(ElementSink sink);
    void removeElementSink(ElementSink sink);
    void clearElementSinks();
    void clearAttributeSinks();
    void clearSinks();
}
#A first dynamic graph
Since Graph is a sink let’s create a graph from a set of events generated by a source.
- A file with information about graphs (in a proper file format) can be a source of events.
- A few graph file formats can handle dynamic.
- GraphStream provides a file format (DGS) that allows to store and load dynamic graphs.

Steps in DGS
The ability to remove nodes and edges make the format dynamic.
Add this to the data/tutorial2.dgs file:
st 2
an "D" label="D"
an "E" label="E"
ae "BD" "B" "D" label="BD"
ae "CE" "C" "E" label="CE"
ae "DE" "D" "E" label="DE"
st 3
de "AB"
st 4
dn "A"
And save it.
#Read the whole file
The file can be read entirely :
- However this will send all events as fast as possible.
- We have no control over the speed at which events occur.
#Read the file event by event We can read the DGS file event by event using an input source:
Graph graph = new SingleGraph("Tutorial2");
graph.display();
FileSource source = new FileSourceDGS();
source.addSink( graph );
source.begin("data/tutorial2.dgs");
while( source.nextEvents() );
source.end();#Read the file step by step - We read the file event by event (line by line in the file), however it still does it as fast as it can. - Note the line while(source.nextEvents()); - Also note that we have to call the begin() and end() methods before and after reading to cleanly open and close the file. - Let’s slow down the process :
- We can also run it step by step so that events between two step appear together